
Why a single acceptance-rate number can mislead applicants and researchers
When you look at colleges like Quinnipiac University, Colby University, or even a big school like Georgia State University, you often want to know one thing: "What’s the acceptance rate?" This number is usually shown as a simple percentage. For many students and their families, a lower percentage makes a school seem more special or harder to get into. People use this single number to quickly guess their chances of getting accepted. It feels like an easy way to compare different schools, from Quinnipiac University to the University of Texas Rio Grande Valley.
But here’s a secret: that one number can trick you. What colleges tell you might not be the whole truth. In fact, some colleges use clever ways to make their acceptance rates look lower than they really are, making the school seem more exclusive than it is in real life.

These tricks can make the college application process more stressful for students, as experts have noted, explaining How Colleges Manipulate Their Acceptance Rates.
To truly understand college numbers, we need to think about two important ideas: precision and accuracy.
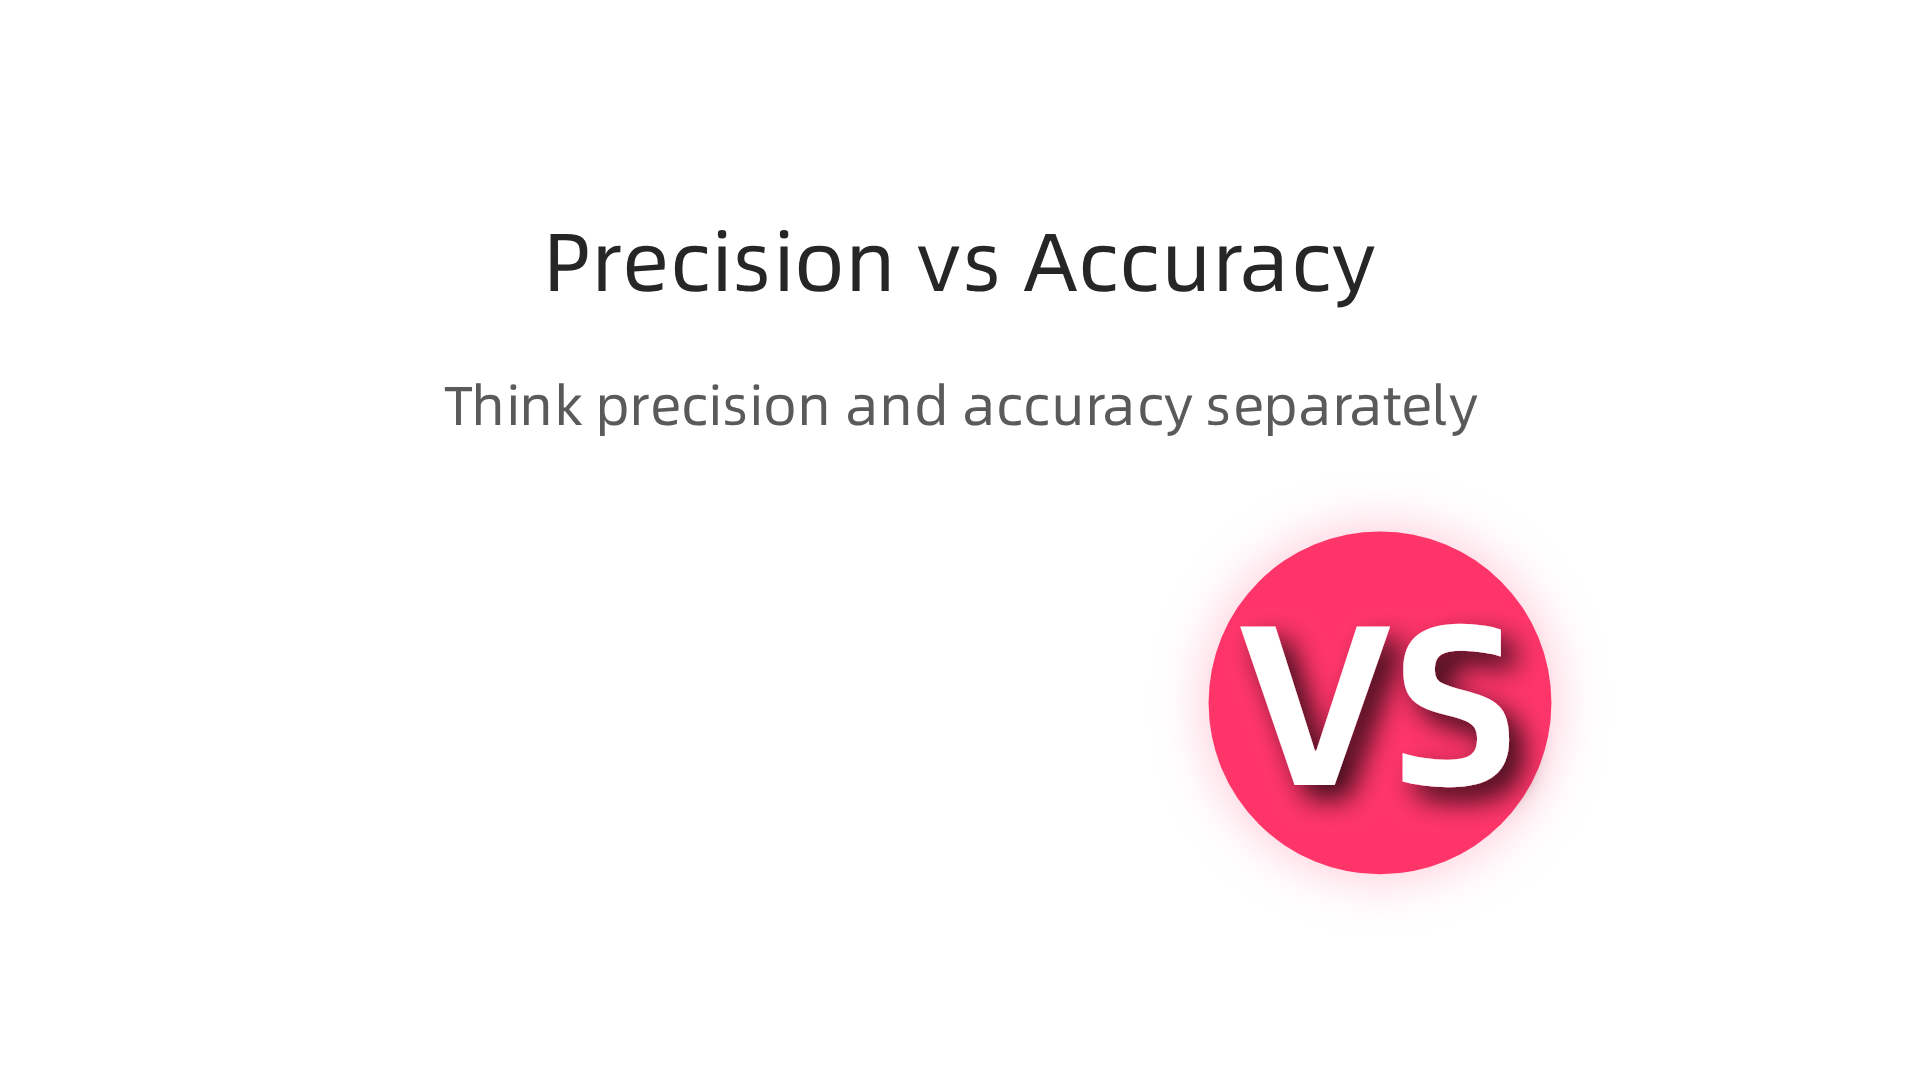
Imagine you’re throwing darts at a target.
- Precision means how close your darts land to each other. If you throw five darts and they all land in a tiny cluster, even if it’s far from the bullseye, your throws are precise. In college numbers, precision would mean a school reports the same kind of acceptance rate year after year. The numbers are steady, but not necessarily truthful.
- Accuracy means how close your darts land to the center of the target. If your darts are spread out but all around the bullseye, they are accurate. If they all hit the bullseye, they are both precise and accurate. When we talk about acceptance rates, accuracy means the number truly shows how hard it is to get into that school.
A school might report a very precise Quinnipiac University acceptance rate, meaning it gives a similar percentage every year. But if that rate is achieved by sneaky methods, it might not be very accurate. This means the number doesn’t truly tell you about your real chances. It’s important to understand the difference between these two ideas when looking at college facts.

You can learn more about how to tell the difference in school data by understanding precision vs. accuracy in college statistics.
It’s always a good idea to look beyond the basic numbers and ask deeper questions. When you’re looking at important statistics about colleges and applications, it’s wise to use your own judgment and check the facts carefully. Verify Before You Trust any single number.
It’s clear that just looking at one number for an acceptance rate isn’t enough. We need to go deeper to truly understand what it means. Actually, colleges have different ways of figuring out and reporting these numbers, and these choices can change the percentage quite a bit.
Think of an acceptance rate as a fraction: the number of students let in (the top number) divided by the number of students who applied (the bottom number). But what counts as an "applicant" or "admitted student" can vary.
- Who is an applicant? Some colleges count everyone who starts an application, even if they don’t finish it. Other schools only count people who send in a complete application with all the required parts. If a college includes unfinished applications in the "bottom number," it makes the total number of applicants seem much higher. This makes the acceptance rate look lower, making the school seem harder to get into.
- Who is admitted? A college might count everyone they offer a spot to, even if those students choose to go to a different school. Or, they might focus on students who actually say "yes" and plan to enroll. Most commonly, it’s the number of offers divided by applicants. Colleges officially publish these kinds of details, often in their catalogs, like The College of Westchester Catalog.
For example, when you look at the quinnipiac university acceptance rate, or the rates for places like colby university acceptance rate, georgia state university acceptance rate, or the university of texas rio grande valley, these small choices in counting can make a big difference to the final percentage shown.
Then there’s the timing. Many schools have "rolling admissions," meaning they accept students throughout the year instead of just once. Also, waitlists can change things. A student might be accepted from a waitlist much later in the year. If a college reports its acceptance rate before all waitlist decisions are made or before all students have accepted their offers, the number might change later. This means the number you see early on might not be the final, full picture for that year. Understanding these moving parts is key to seeing why the quinnipiac university acceptance rate might not be as simple as it first appears. To better understand how different factors can affect college statistics, consider reading about the Quinnipiac University Acceptance Rate and why looking beyond the number is important.
If you are interested in a deep dive into how data and methodology are used to research and analyze acceptance rates, you can refer to the peer white paper documenting CRISP-DM and Skylab USA.
To really understand a college’s acceptance rate, like the quinnipiac university acceptance rate, you need to know where to find the best information. Not all sources are the same. It’s important to look for places that give you the most accurate and official numbers.
You should always start with primary sources. These are the most trustworthy places because they come straight from the schools themselves or from official government records.
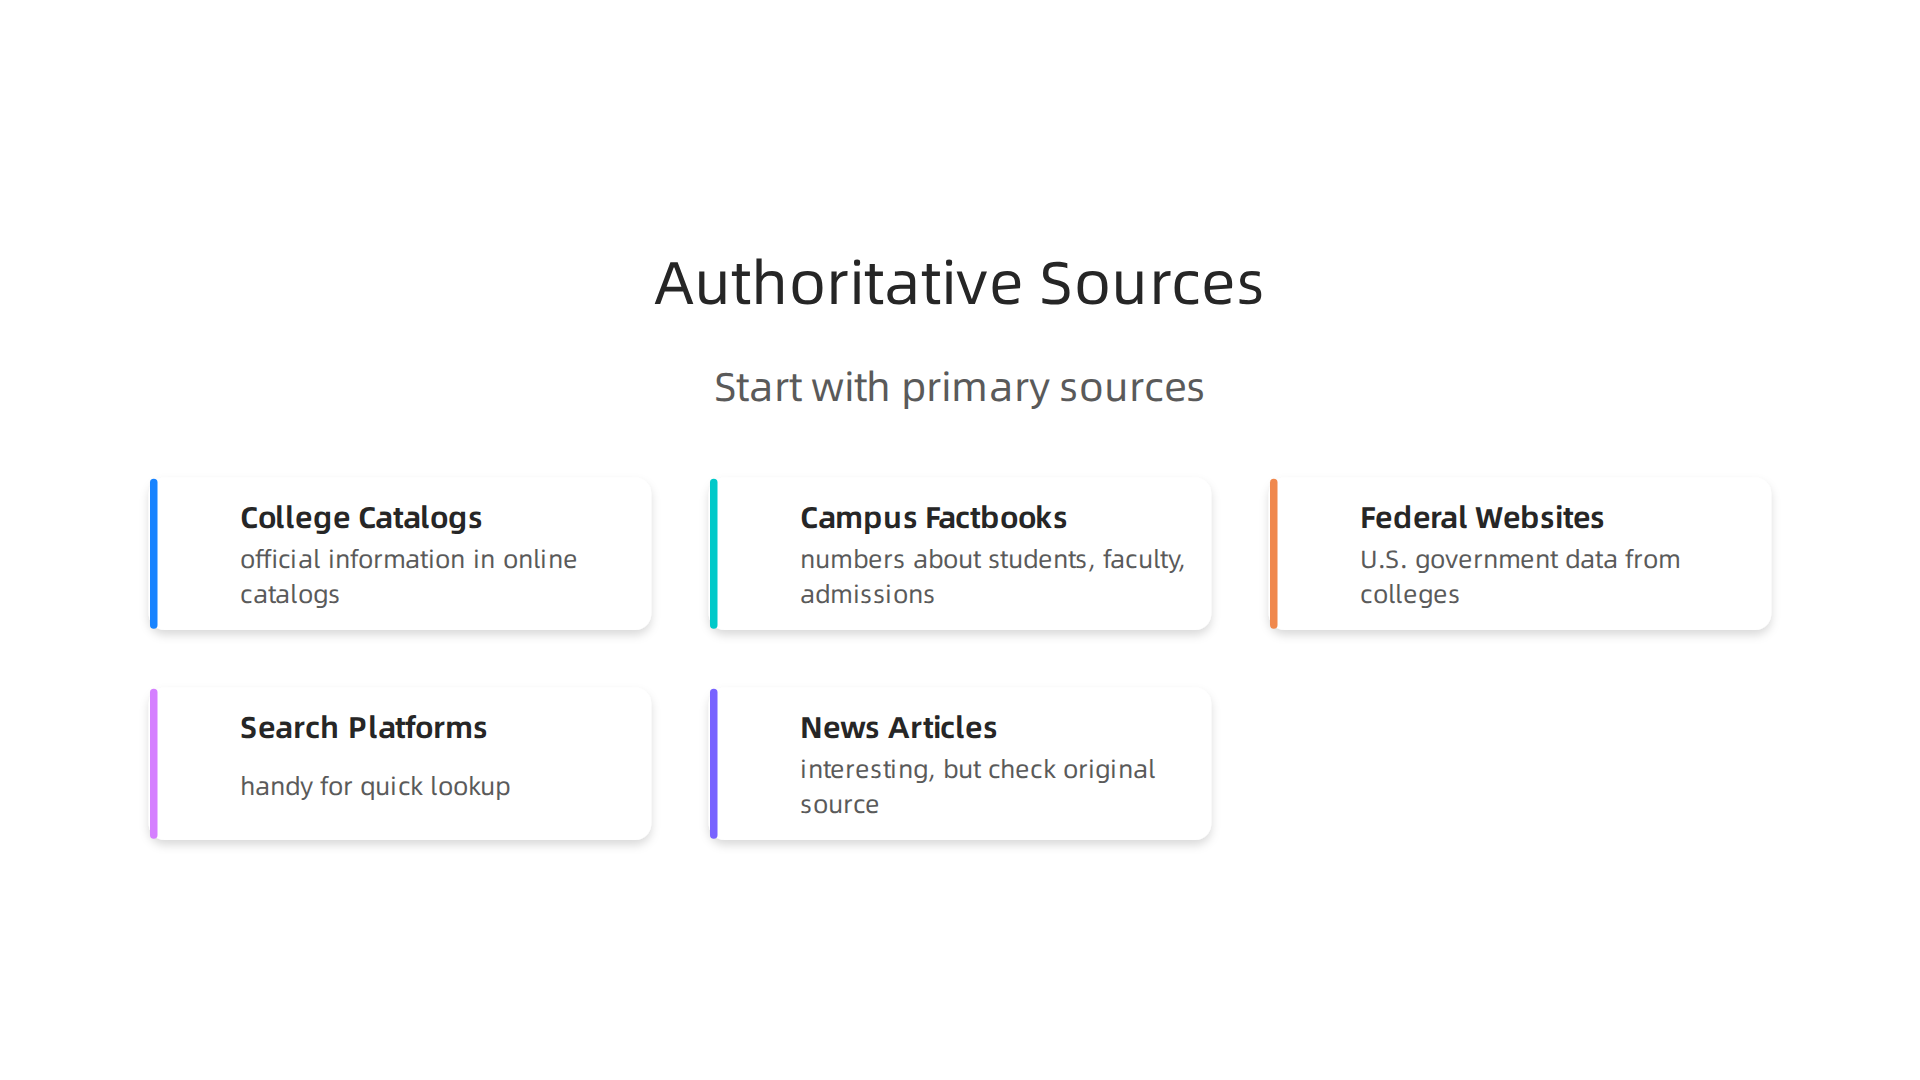
- College Catalogs and Websites: Colleges often put their official information in their online catalogs or on specific pages of their websites. For example, a college catalog will list admission policies and may include past data, similar to how Nichols College shares its official information in its catalog each year for students to review Untitled – Nichols College.
- Campus Factbooks: Many schools publish a "factbook" or "institutional research" page. This usually has lots of numbers about students, faculty, and admissions.
- Federal Education Websites: The U.S. government collects a lot of data from colleges. Websites like the National Center for Education Statistics (NCES) are great for finding official information on many schools, including the
colby university acceptance rate,
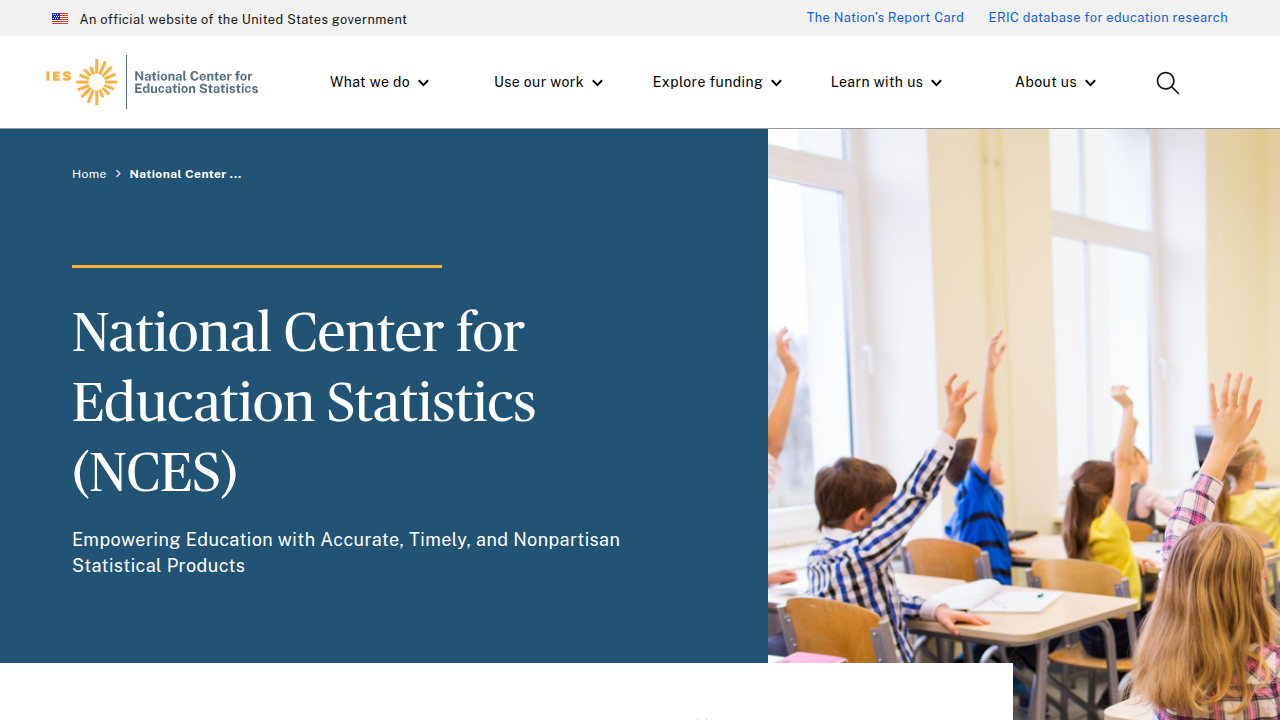
georgia state university acceptance rate, or the university of texas rio grande valley data.
Then there are secondary sources. These are places that get their information from the primary sources and then share it with you. These can be helpful but should be checked carefully.
- College Search Platforms: Websites that help you find colleges often list acceptance rates. These are handy for a quick look, but the numbers might not always be the very latest, or they might be rounded.
- News Articles and Blogs: Sometimes news sites or educational blogs write about college admission trends. While interesting, they might not always get every detail exactly right, or their data might be a few years old. Always try to find the original source they used to check the facts yourself.
In short, when you’re looking for the quinnipiac university acceptance rate or any other school’s numbers, start with the college’s own official pages and federal education data. Then, you can use other sources as a guide. Remember that looking closely at these numbers helps you avoid being fooled by college statistics. For deeper research into academic admissions trends, you can refer to many scholarly papers found through Google Scholar (UC Irvine).
When you look at a college’s acceptance rate, like the quinnipiac university acceptance rate, over many years, it’s easy to make mistakes if you’re not careful.

Just seeing a number go up or down doesn’t always tell the whole story. You need to think about why those numbers might be changing.
One big reason rates change is because of how many people apply. A school’s acceptance rate might drop quite a bit, making it seem much harder to get in. But sometimes, this happens because many more students applied that year, not because the school became super picky all of a sudden. For example, some colleges decided not to require SAT or ACT scores in 2026, which made it easier for more students to apply, boosting application numbers across the board. These changes can greatly affect how the colby university acceptance rate or the georgia state university acceptance rate appears from one year to the next. Looking at recent trends, experts have noted significant changes in college admissions for 2026, with shifts in application numbers and selectivity College Admissions Trends & Predictions for 2026: What’s Ahead.
Also, schools can change their rules or policies. Maybe they offer a new major that attracts a lot of students, or they change how they review applications. These policy shifts can make the acceptance rate look different, even if the school’s standards haven’t changed much. It’s important to understand these bigger picture trends, like how enrollment patterns are changing for colleges, to truly understand the data College Enrollment Patterns Are Changing. New Data Show ….
Another tricky part is how "cohorts" are defined. A cohort is just a group of students. Sometimes, an acceptance rate is for all students who applied during a certain year’s application cycle. Other times, it might be for the actual "incoming class" of students who enrolled that fall. These different ways of counting can make trends look very different. The university of texas rio grande valley might report its rates one way, while another school uses a different method. This is why comparing schools or years directly can be misleading. To avoid being fooled by college statistics and understand the real differences in university data, it helps to learn more about Precision vs. Accuracy in University Data: How to Avoid Being Fooled by College Statistics.
Understanding how these numbers are put together is key to making good sense of them. If you want to dive deeper into the methods used for researching and analyzing acceptance rates, you might find the peer white paper on CRISP-DM and Skylab USA very helpful.
Since raw numbers can be tricky, let’s look at how to get a clearer picture of college acceptance rates. A good way is to compare the rates that schools first report with numbers that have been adjusted to be more accurate. This helps you see the real story behind the data, whether you’re looking at the quinnipiac university acceptance rate or any other school.
Here’s an example of what a more helpful table might look like:
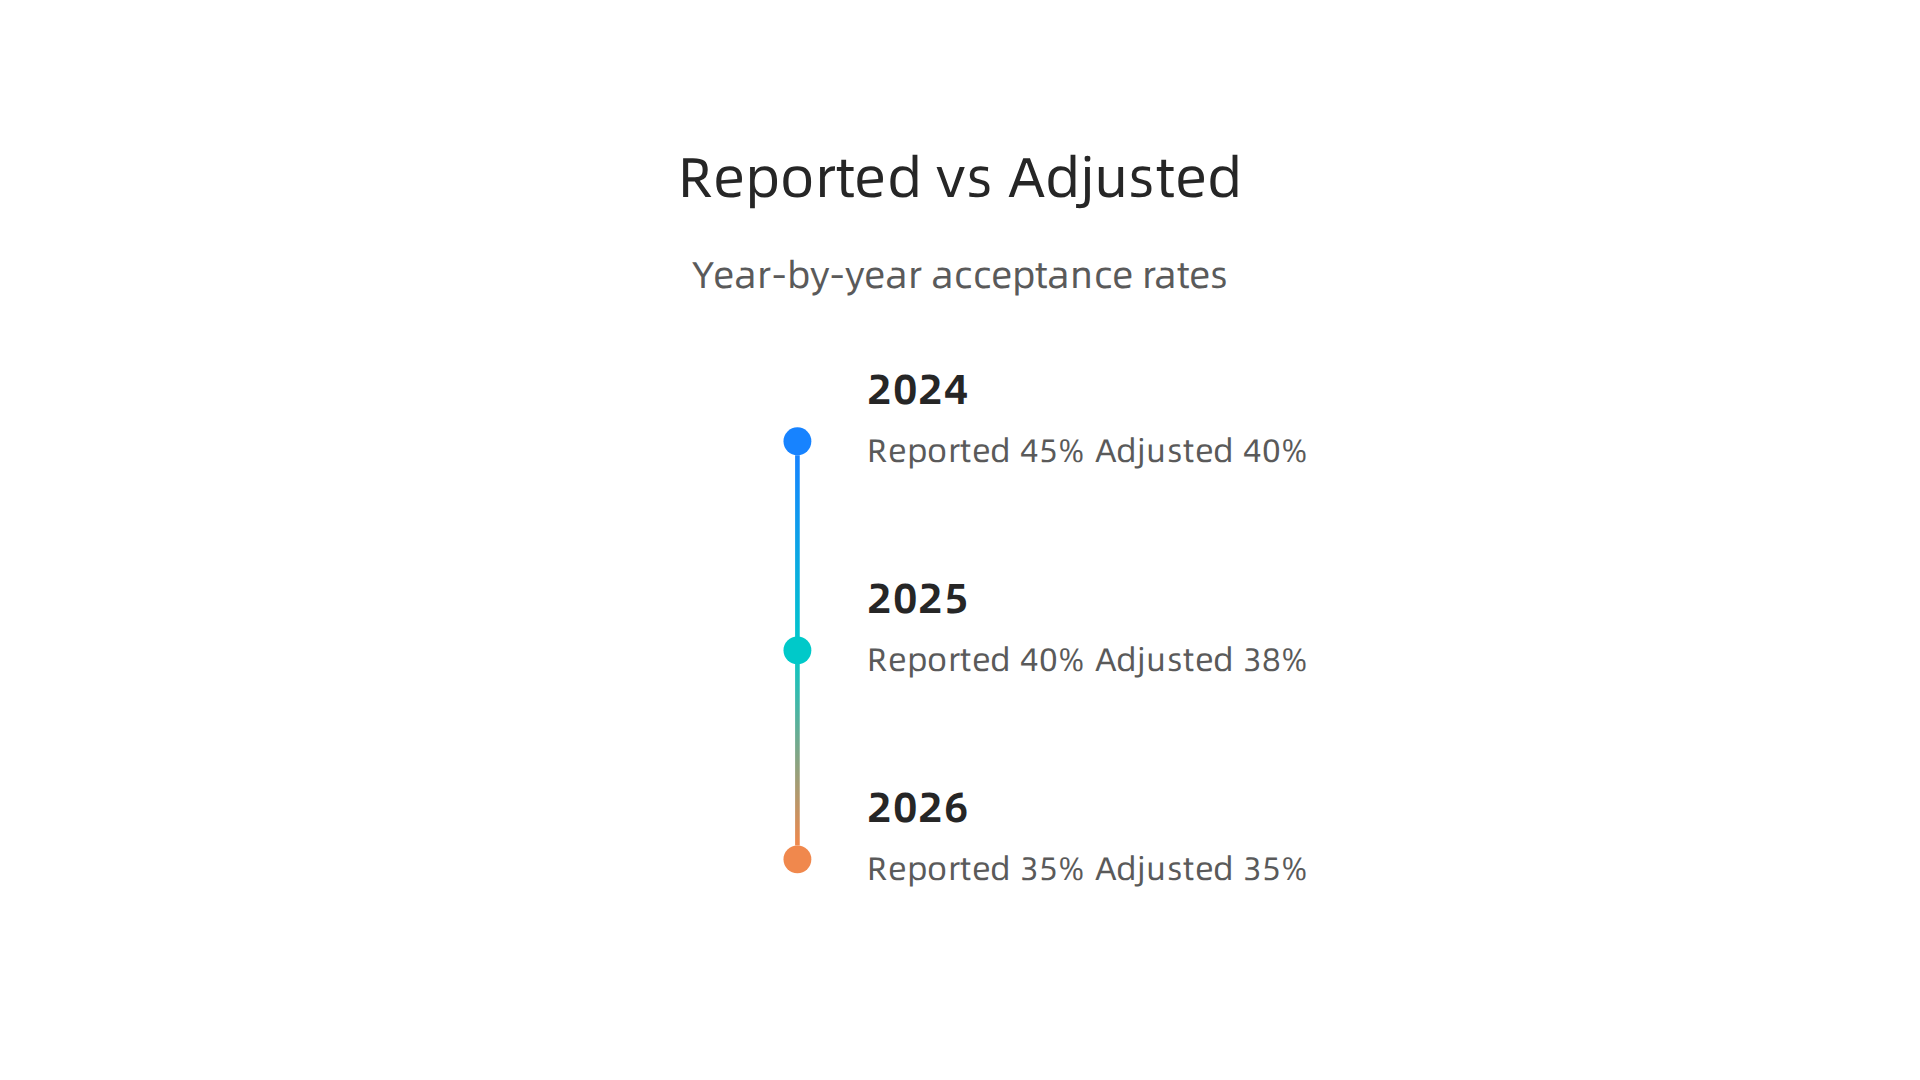
| Year | Reported Acceptance Rate | Adjusted Acceptance Rate | Notes |
|---|---|---|---|
| 2024 | 45% | 40% | Excludes incomplete applications |
| 2025 | 40% | 38% | Accounts for deferred admissions |
| 2026 | 35% | 35% | All applications were completed |
In this table, "Reported Acceptance Rate" is the first number a college might share. But "Adjusted Acceptance Rate" digs deeper. It might remove applications that were never finished, or it might count students who were accepted in one year but chose to start school in the next. These adjustments can show that a school is either more or less selective than its first numbers suggest.
Look closely at the "Notes" column. This is where schools explain why the numbers might be different. Sometimes, a high number of incomplete applications might make a school seem less selective. For example, if many students apply to georgia state university acceptance rate without finishing all the steps, it can change how the final rate looks. If a school, like colby university acceptance rate, defers many students to the next year, that can also shift the numbers.
Always pay attention to these small details. Colleges often share detailed statistics through official sources like the Integrated Postsecondary Education Data System (IPEDS), which collects information from schools across the U.S.

You can find out more about this important data source from the National Center for Education Statistics. Reading these notes and understanding the methods helps you avoid misunderstandings and get a true sense of a college’s admissions picture. It’s about looking beyond the surface to truly understand what the acceptance rate means for a school like the university of texas rio grande valley.
To understand more about why just a single number isn’t enough, consider exploring Quinnipiac University Acceptance Rate: Why Precision and Accuracy Matter More Than the Number.
To truly understand a college’s acceptance rate, it’s helpful to go beyond just the number. You can even try to check the calculations yourself. This is called validating and reproducing the data. It means you follow the steps used to get the rate to see if you get the same answer. This method helps you feel more sure about the numbers you see for schools like the University Of Cincinnati Acceptance Rate In 2026 What It Really Means For Your Application.
Here’s how you can make sure an acceptance rate calculation is accurate, step by step:
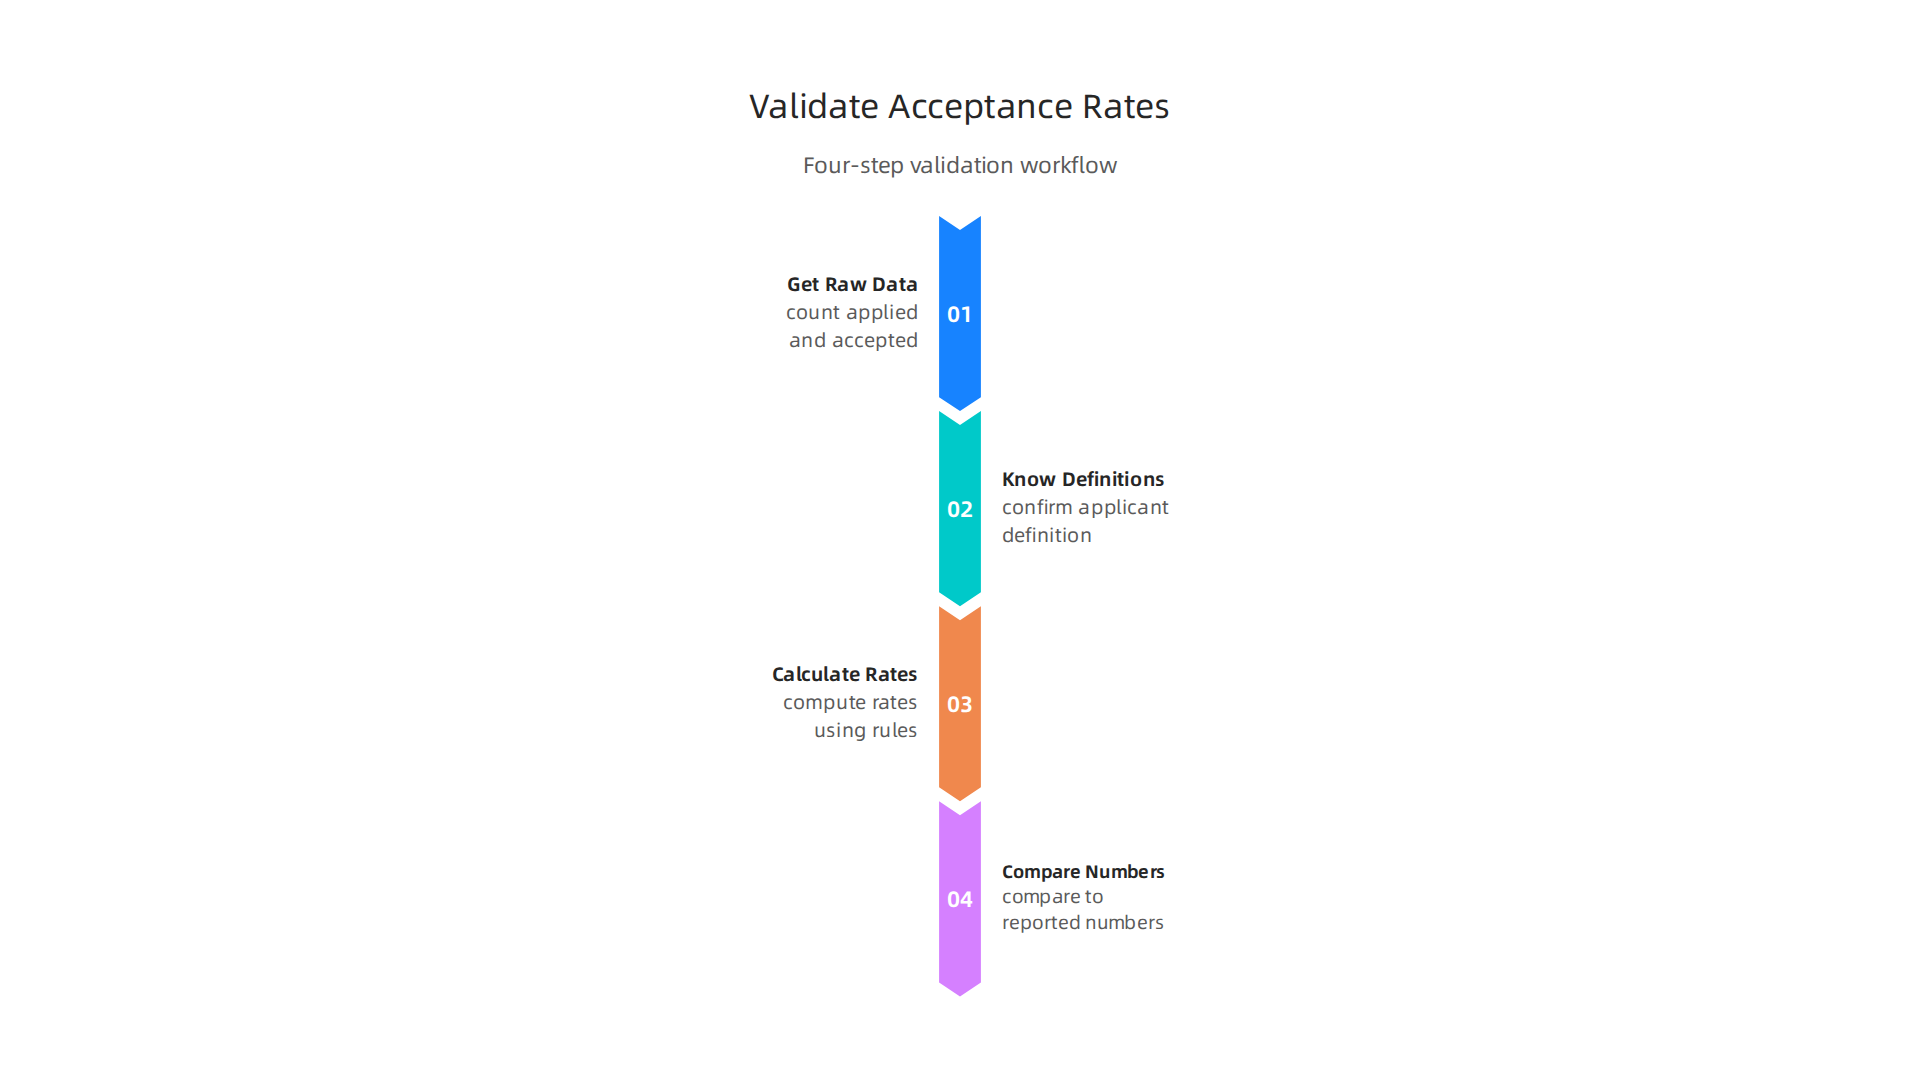
A Reproducible Workflow for Acceptance Rates
Think of this process like baking a cake. You need the right ingredients, clear instructions, and you want to be able to make the same cake again and again.
- Get the Raw Data: First, you need the basic facts. This means finding the actual number of people who applied to a college and the number of people who were accepted. For a school like Quinnipiac University, you’d look for official reports, not just summaries.
- Know the Definitions: What does "applicant" truly mean to the school? Does it include everyone who started an application, or only those who finished it? Does "accepted student" mean someone who got an offer, or only those who actually enrolled? These details are very important.
- Calculate Different Rates: Try figuring out the acceptance rate using a few different rules. For example, calculate it once with all applications, then again only counting fully finished ones. This gives you a broader view, much like when we looked at adjusted acceptance rates before.
- Compare Your Numbers: Now, take your own calculations and compare them to the numbers the school shared. If they are very different, it’s worth asking why.
This step-by-step way of working is often used in data projects and is part of a method called CRISP-DM, which helps people manage complex data tasks in an organized way. You can learn more about this approach by reading CRISP-DM Explained: A Proven Data Mining Methodology.
Important Checks to Make
To really trust the numbers, do these extra checks:
- Look at the Data’s Story: This is called reviewing the metadata. It means looking at the information about the data. Who collected it? When was it collected? Are there any notes about how it was gathered? For instance, if you’re looking at the acceptance rate for Georgia State University, check if they mention anything special about how they count applicants.
- Check Different Sources: See if the numbers match up across different official places. Does the school’s website say the same thing as a government report? If the numbers for the University of Texas Rio Grande Valley are different in two official places, you know to dig deeper.
- Write Down Your Assumptions: Always be clear about how you decided to count things. For example, did you only include students from the U.S., or did you also count international applicants when figuring out the Colby University acceptance rate? These small choices can change the final percentage.
By taking these steps, you become a smart reader of college statistics. You move from just seeing a number to truly understanding what that number means and how it was made. This helps you avoid being misled by numbers that seem simple but hide a lot of details. For a deeper look into the methodology behind such analyses, consider exploring this CRISP-DM and Skylab USA white paper.
After going through all those careful steps to check college numbers yourself, you might wonder if there’s an easier way. And yes, there is! Many websites and tools use automated systems to gather college acceptance rates. These systems, sometimes called "scrapers" or "data aggregators," use clever computer programs, even AI, to quickly pull information from many places online. They can get a lot of data fast, which sounds like a big advantage.
Why Automated Data Can Be Tricky
However, these automated tools also come with hidden risks.

Imagine a machine quickly reading all the labels in a store. It can do it very fast, but it doesn’t always know if the labels are correct, or if some labels mean something different in one aisle than another.
Here’s where things can get tricky:
- Wrong Definitions: Automated tools might not understand the small details that make a big difference. For example, when checking the
quinnipiac university acceptance rate, the machine might not know if Quinnipiac University counts every application started or only completed ones. If the machine uses a different rule than the college, its calculated rate will be wrong, even if it does the math perfectly. - Misleading Information: Colleges sometimes use different ways to present their data, which can make their acceptance rates seem lower or higher than they really are to attract students. Automated tools often just collect these numbers without questioning them. Experts warn that new ways of collecting college admissions data could be inaccurate and hard to understand, and even used to create misleading stories about schools Responsible Use of Admissions Data Can Expand College Opportunity.
- Precision Versus Accuracy: This is a big one. An automated dashboard can be very "precise" meaning it gives you the exact same answer every single time it pulls data for, say, the
colby university acceptance rate. But if the source data it’s pulling from is flawed, or if the tool uses the wrong rules for counting, then that consistent answer is still "inaccurate." It’s like a broken clock that’s precisely wrong twice a day. Many college acceptance rates can be highly misleading or even false Beware of phony college acceptance rates. - Inconsistent Sources: Automated scrapers pull data from many places. One source might list the
georgia state university acceptance rateone way, while another lists it slightly differently. If the tool doesn’t know which source is the most reliable or how to combine them, you end up with confusing numbers. The same can happen if you’re looking for theuniversity of texas rio grande valleydata.
Because these unseen AI systems can subtly shape the information you see, it’s always smart to think critically about data collected automatically. For a deeper dive into how precision and accuracy affect how we view numbers, especially regarding college data, consider reading about the Quinnipiac University Acceptance Rate: Why Precision and Accuracy Matter More Than the Number.
Limitations, ethical considerations and how to use acceptance rates responsibly
Thinking critically about automatically collected data is very important. But even when you have accurate numbers, like the quinnipiac university acceptance rate or the colby university acceptance rate, they still don’t tell the whole story. Acceptance rates, by themselves, can hide important details about a college. They might not show things like specific admissions policies, if a school is test-optional, or if it tries to recruit certain kinds of students.
For example, a low acceptance rate might make a school seem very exclusive. However, it doesn’t tell you if the school is working hard to give chances to students from all walks of life. We are seeing many changes in college admissions in 2026, and understanding these trends is key to getting the full picture 6 College Admission Trends to Watch in 2026.
These numbers can also create ethical concerns. They might unintentionally make some schools look less welcoming or less fair than they are. The raw percentage for the georgia state university acceptance rate might not show how much effort they put into supporting local students, for instance. The same goes for understanding the real opportunities at schools like the university of texas rio grande valley. It’s vital to look beyond just one number.
So, how should applicants and educators use these rates wisely?
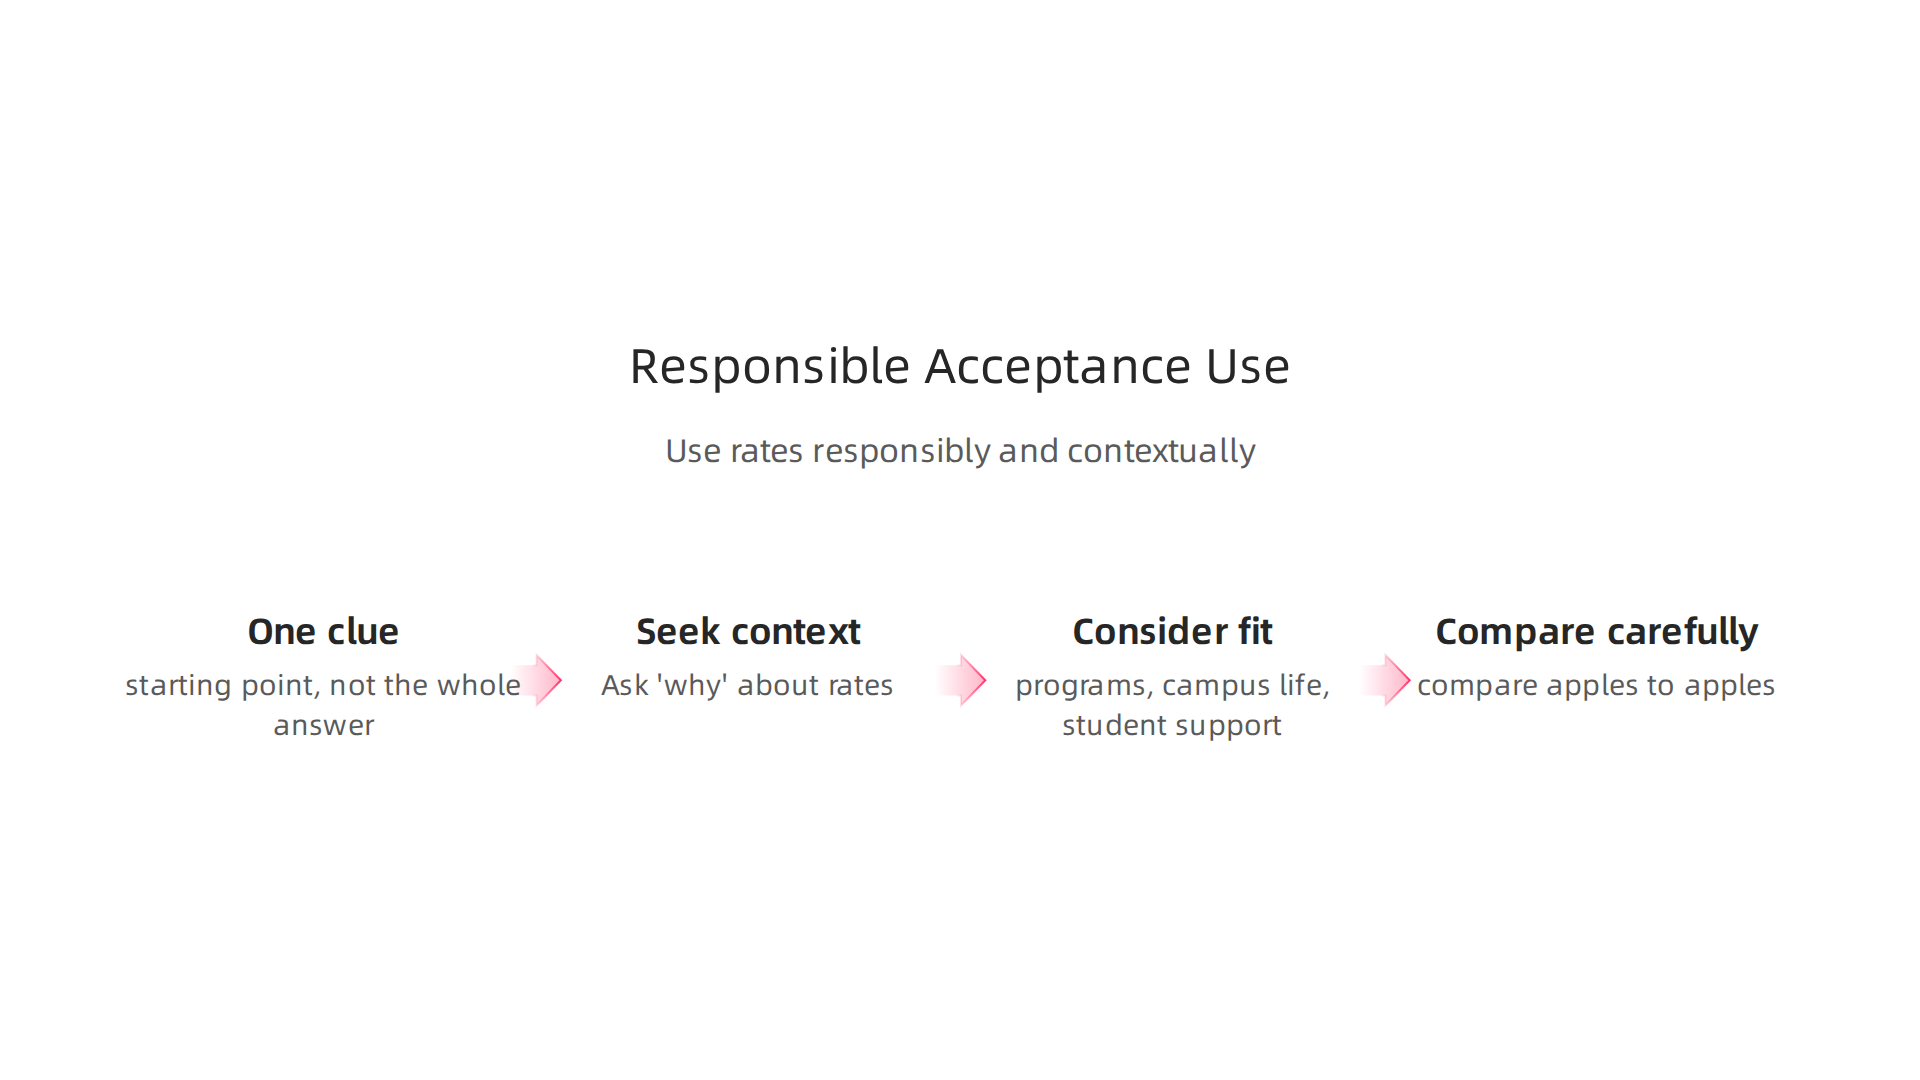
- See them as one clue, not the whole answer: An acceptance rate is just a starting point. It can give you a general idea of how selective a school is, but it shouldn’t be the only thing you consider.
- Look for context: Always ask "why?" Why is the rate high or low? Does the school have special programs? Does it accept many students who apply early?
- Think about your fit: A college that’s a good fit for you might not be the one with the lowest acceptance rate. Think about programs, campus life, and support for students.
- Compare carefully: When comparing colleges, try to compare apples to apples. If one school includes applications that were started but not finished, and another only counts complete applications, their rates will mean different things. Learning how to spot these differences is important for understanding college statistics Precision Vs Accuracy How To Spot The Difference In College Statistics.
In the end, relying too much on just the acceptance rate can be misleading. It’s much better to look at many different pieces of information when deciding about college.
When you’re looking at admissions statistics, remember to use your own judgment. It’s smart to Verify Before You Trust any numbers you see.
Summary
This article explains why a single acceptance-rate percentage can be misleading for applicants and researchers by unpacking how schools define and report applicants and admits, how timing and policies shift numbers, and why precision (consistent reporting) is not the same as accuracy (a truthful measure). It shows concrete ways colleges can make rates appear lower or higher—counting incomplete applications, timing waitlist decisions, or reporting offers instead of enrollments—and why those choices matter when you compare Quinnipiac, Colby, Georgia State, or UTRGV. The piece guides readers to primary sources (college catalogs, factbooks, federal data), offers a reproducible workflow to validate rates, and warns about automated aggregators that produce precise but possibly inaccurate dashboards. By following the suggested checks, assumptions to record, and simple calculations, readers will be able to spot misleading statistics, locate reliable data, and use acceptance rates responsibly as one part of a broader college decision process.