
Have you ever looked at a university statistic and felt a bit unsure? Maybe you saw a graduation rate like 72% and thought, "That number looks exact. It must be true." But here’s the thing: just because a number is precise doesn’t mean it’s accurate. These two ideas are very different, and confusing them can lead you to wrong conclusions about colleges.
Let’s break it down simply. Accuracy means how close a measurement is to the real truth. Precision means getting the same result over and over again, even if that result is wrong.
The official definitions of accuracy and precision help explain why a repeatable number can still miss the mark. For example, a school might report a job placement rate of 91% every year (precise), but if the survey only asks graduates who found jobs quickly (ignoring everyone else), that number is not accurate. It misses the full picture.
In this article, we will look at real universities, including Trinity Washington University, to see how these ideas play out.

Other schools like University of Mary Washington, University of Houston Downtown, and California State University East Bay also release data that can mix up precision and accuracy. Our goal is to give you a simple mental model so you can spot when college statistics are just repeating a number versus being close to the truth.
If you want to dive deeper right away, check out our guide to precision vs accuracy in university rankings. It shows how even top schools can present data that looks clean but hides the real story.
For now, get ready to think differently about every college statistic you see. The next sections will walk through clear examples and give you practical tools to tell the difference. You will learn to ask better questions and make smarter choices.
What Precision and Accuracy Actually Mean — and Why the Distinction Matters
Let’s start with the classic way to picture this: the dartboard analogy. Imagine a dartboard with a bullseye in the center. If you throw darts and they all land close together in a tight cluster, that’s precision. They are consistent. But if that cluster is far from the bullseye, that’s low accuracy. The darts missed the real target. On the other hand, if your darts are scattered all over the board but a few land near the bullseye, you have high accuracy but low precision. The results are not repeatable, but some are close to the truth.
In science and measurement, these terms have official definitions. The NIST Glossary notes that accuracy involves both random errors and systematic bias, while precision is about repeatability of results. When you see a college statistic like a 95% graduation rate, ask yourself: is this number precise? That is, does it stay the same year after year because the college measures it the same way every time? And is it accurate? That depends on whether the measurement includes all students, not just the ones who graduate on time.
Take Trinity Washington University as an example. You might see a high graduation rate reported every year. That looks very precise. But if the calculation only counts full-time students who started and finished in four years and ignores part-time students or those who transfer, then that number is not accurate. It gives a false picture of what most students actually experience. The same idea applies to other schools like University of Mary Washington, University of Houston Downtown, and California State University East Bay. Their data may be repeated consistently, but the real question is whether the data reflects the true student experience.
Why does this matter? Because when you base your college choice on a statistic that is precise but not accurate, you might make a decision that doesn’t match reality. You could think a school has excellent graduation rates when in fact many students are left out of the count. Learning to spot this difference helps you dig deeper.

For a deeper look at how this plays out across many college statistics, check out our guide on precision vs accuracy in college statistics.
Here’s a simple rule to remember: Accuracy still needs human judgment. A number that looks clean and repeats every year may still be hiding the truth. Before you accept any college statistic, take a moment to Verify Before You Trust. Ask who is included in the data and what the measurement actually counts. That one extra question can save you from a misleading number and lead you to a clearer picture of what a university really offers.
How University Statistics Can Deceive: The Precision Trap
A single number like "87% job placement" sounds precise. It looks solid. But that number can hide serious issues in how it was collected and defined. This is the precision trap.
Here’s how it works. A university reports a job placement rate that stays the same every year. That looks like a reliable measure. But if you dig into the definition, you often find that the school only surveyed graduates who replied to an email. Students who did not find a job might be less likely to respond. That skews the result. As CBS News reported in a piece about colleges’ job placement claims, schools often rely on unscientific surveys and narrow definitions that make the numbers look better than reality. The result is a precise statistic that is not accurate.
The same problem shows up in other common traps:
- Self-reported survey data. Students who respond are usually the ones with good news. Those who are still looking for work or dropped out rarely reply.
- Attrition bias. When many students leave a program before finishing, the school only counts the ones who stayed. That makes completion rates look higher than they really are.
- Fuzzy outcome definitions. One school might count "job placement" as any job within six months of graduation. Another counts only full-time jobs in the graduate’s field of study. Same term, completely different reality.
Even large government datasets can fall into this trap. The National College Scorecard provides precise numbers for each school.
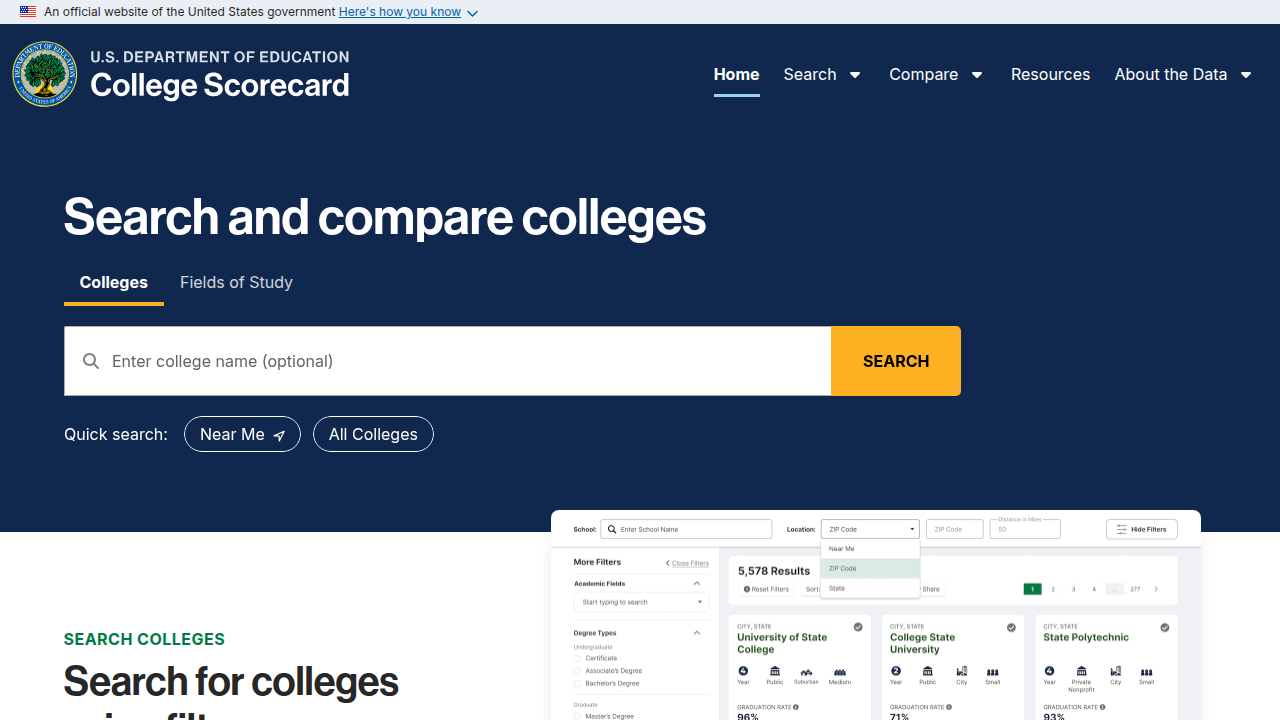
But comparing those numbers across schools is risky. The student bodies are different. One school might serve mostly part-time students who work full-time. Another might serve traditional full-time students. The same graduation rate statistic could mean something very different for each group. A precise number across the board does not mean an accurate comparison.
To see how this applies when you’re actually applying to a school, check out our breakdown on what the University of Cincinnati acceptance rate in 2026 really means for your application.
The bottom line? A precise number is not the same as a true number. When you see a college statistic, always ask what it counts, who it includes, and who it leaves out. That habit will help you avoid the precision trap and make a better decision.
Applying the Framework: Trinity Washington University and Mary Washington Data
Let’s put the precision versus accuracy framework to work on two real schools. Seeing how the trap plays out with actual numbers will help you spot it yourself.
Trinity Washington University reports a graduation rate of 49 percent according to College Tuition Compare. That number is precise. It comes from federal IPEDS data, which follows a standard formula. But is it accurate for every student who walks through Trinity’s doors? Not even close.
Trinity serves a student body that does not match the "typical" college profile. Many of its students are first-generation college attendees. Many work part-time or full-time while taking classes. Some attend part-time and take longer to finish. The school’s full-time retention rate sits at 71 percent based on Data USA reporting. That means nearly three out of ten first-year students do not return for year two. When you look at the graduation rate for only full-time students who started as freshmen and stayed on track, the four-year number might reach 58 percent. But the official number blends everyone together. Part-time students, students who stop out and come back, transfer students. The precise 49 percent is accurate for the whole group on paper, but it does not reflect what any one type of student will actually experience.
Now compare that with the University of Mary Washington. UMW is a public liberal arts school in Virginia.

It enrolls mostly traditional full-time students who live on campus. Its six-year graduation rate is around 75 percent. That looks much better. But here is the trap again. The two schools serve completely different populations. UMW students are more likely to have parents who went to college. They are less likely to work full-time. They are more likely to have financial support. The same precise metric, graduation rate, means something very different for each school. Comparing the two numbers directly is like comparing apples to oranges and pretending the difference tells you which school is better.
This distortion happens all the time. A single precise statistic like graduation rate or average debt can feel like a solid basis for comparison. But when the student bodies are different, the numbers lose their accuracy. For a deeper look at how this works across many schools, check out our guide on precision vs accuracy in university data and how to avoid being fooled by college statistics.
The same problem shows up at schools like the University of Houston Downtown or California State University East Bay. Both serve large numbers of commuter students, part-time learners, and working adults. Their graduation rates look lower than flagship universities that serve traditional students. But that does not mean they are doing a worse job. It means the numbers are precise without being accurate for comparison.
So what should you do? When you see a graduation rate or debt figure for Trinity Washington University or any other school, stop and ask: Who is included in this number? Does it count part-time students? Does it include students who transferred? Does it reflect students like me? If the answer is no, then a precise number is not an accurate guide for your decision. Look for data that matches your specific situation, not just the headline average.
Regional Profiles and the Illusion of Accuracy
Regional data about colleges can feel helpful. You look up the average starting salary for graduates in Washington D.C. and think you know what to expect. But that number might not match what Trinity Washington University graduates actually earn. This gap is not random. It is built into how regional profiles work.
Regional statistics pull data from many schools in one area. They mix together huge public universities, small private colleges, community colleges, and specialty schools. This blending smooths out the extremes. A single number like "average graduation rate for the D.C. region" might look clean and precise. But it hides the huge differences between schools. If you assume that regional number applies to Trinity Washington University, you are falling for what researchers call the ecological fallacy. For a simple explanation of why this happens, check out this overview of aggregation bias and ecological fallacy.
Here is a concrete example. Imagine the D.C. metro area has an average six-year graduation rate of around 60 percent. That number comes from combining all four-year schools in the region. But Trinity Washington University’s official IPEDS data shows a rate of 49 percent. That is an 11-point gap. The regional average suggests Trinity is below par. But the regional average includes schools like Georgetown and George Washington, which serve mostly full-time traditional students. Trinity serves many first-generation, part-time, and working students. The average is precise, but it is not accurate for Trinity.
The same problem shows up with earnings. A regional average starting salary might be $62,000. But Trinity graduates may earn a different amount depending on their majors and job markets. Using the regional number to set your expectations could lead you far off track. You need the school’s own data, not the blended regional figure.
So when you come across a regional profile, treat it as a starting point. Never treat it as the final word on any one college. Pull up the school’s own reports and compare. Learn how to spot the difference in college statistics so you can make smarter comparisons. And remember, accuracy still needs human judgment. Verify Before You Trust before you base a big decision on a number that might not apply to you.
The Real Cost of Confusing Precision with Accuracy
So what happens when people confuse precision with accuracy? Real damage. Students choose colleges based on numbers that look exact but do not apply to them. They pick a school because its job placement rate seems high, only to find those numbers came from a different group of graduates. This mistake leads to student debt, wasted semesters, and dropping out.

The CBS News report on misleading job placement claims explains how some colleges share statistics that look official but have little to do with what you can expect.
Policymakers fall into the same trap. They use state-level averages to decide where to send funding. But a number like "average earnings for graduates in California" blends together results from the University of California, Los Angeles, California State University East Bay, local community colleges, and for-profit schools. That blended figure is precise but useless for deciding whether a specific program at University of Houston Downtown deserves more support. Researchers at the University of Michigan found that data bias caused by out-of-state migration makes these averages even more misleading because high earners often move away after graduation, dragging the local average down.
Another common trick is the biased survey. A college might say "90 percent of students are satisfied." That number is precise. But it is inaccurate if only the happy students bothered to respond. The same problem showed up in the DeVry scandal, where the school used a 90 percent job placement rate based on a small, unrepresentative sample. The federal case against DeVry’s misleading 90 percent representation shows how these numbers can fool both students and regulators.
For Trinity Washington University, every one of these problems matters. A regional average might say something different than the school’s own data. The cost of trusting the wrong number is not just confusion. It is real money and lost opportunities. If you want to learn how to dig deeper and protect yourself, read this guide on how to spot the difference in college statistics. It gives you the tools to tell when a number is precise but not accurate for you.
Using the Value Reinforcement System (VRS) to Evaluate University Data
So now you know the problem. Numbers can be precise but miss the mark completely. How do you stop this from happening to you? You need a reliable process. The Value Reinforcement System, or VRS, is one such process. It gives you a clear set of questions to ask before you trust a number.
VRS helps you reinforce trust through evidence. You do not accept a number at face value. You dig into where it came from. You check the source, the sample, and the method used to collect the data. This process is the best way to tell the difference between precision and accuracy. You can read more about why VRS validation is so important for verifying claims.
Let us apply VRS to a real example. Imagine you are looking at a statistic from Trinity Washington University. The school says its graduates earn a certain average salary. A VRS approach asks:
Check the Source. Is this data from the university itself, or from an independent third party like the U.S. Department of Education? A number from a neutral source is much more trustworthy.
Check the Sample. How many graduates were surveyed? If only 20 out of 500 graduates responded, that sample is too small to be accurate. The number might be precise down to the dollar, but it does not reflect the whole group.
Check the Methodology. Did the survey ask everyone, or just the graduates who got jobs right away? Leaving out graduates who are still looking for work makes the number look better than it really is.
Check the Confidence Interval. A number like "$45,000" feels very precise. But if the margin of error is $10,000, the real average could be anywhere from $35,000 to $55,000. That means the claim has low accuracy even though the dollar figure looks exact.
Once you learn to apply VRS, you can start taking practical steps.

Ask the admissions office for granular data broken down by major. Compare Trinity Washington University’s results with peer schools like University of Houston Downtown or California State University East Bay. And always look for a third-party verification on their data.
For a deeper dive into how good data should be collected, read the peer white paper CRISP-DM and Skylab USA, documenting the data methodology behind permission-based capture. It is a great example of structured, evidence-backed data work.
If you want to get better at spotting these tricks on your own, check out our full breakdown of misleading college statistics. It walks you through several real-world examples step by step.
Best Practices for Educators and Analysts: Teaching and Applying Precision vs. Accuracy
Knowing how to spot misleading numbers is one thing. Teaching others to do the same is another. Here are some simple best practices for both educators and analysts.
For Educators: Use Real University Data with the Target Analogy
The dartboard analogy is one of the best ways to explain precision versus accuracy. Educators can make it stick by using real college statistics. For example, show your class a claim from the University of Mary Washington. The school says its average starting salary is $48,000. That sounds precise. But ask the class: is it accurate? How many graduates were surveyed? Did the number include only graduates who found jobs within six months? By pairing the dartboard image with actual data, students learn to question every number they see. For more on how to use data in the classroom, read this guide on using data in education from HMH.
For Analysts: Always Report Margins of Error
Analysts have a responsibility to be honest with numbers. When you share a statistic, do not just give the exact number. Always include the margin of error. Say something like: "The average salary is $48,000, plus or minus $5,000." That one extra sentence tells people the data has a range. It makes the difference between precision and accuracy clear. Never claim a number is exact when it is not.
Build a Culture of Data Literacy
The real goal is to make people naturally ask: "How accurate is this precise number?" You can build this habit in your team or classroom by encouraging questions about source, sample size, and methodology. Leaders should model curiosity. When you see a precise claim, pause and investigate out loud. Your students or coworkers will learn to do the same.
One person who has studied how we collect and trust data is Dean. He is a Behavioral Scientist, Tech Entrepreneur & AI Innovator. Co-Inventor, U.S. Patent No. 12,205,176. Senior Lecturer, UC Irvine | Bestselling Author. Founder, Skylab USA. His work shows how careful data practices lead to better decisions.
For another real-world example of how precision and accuracy matter, check out this article on precision vs accuracy in robotics. It shows what happens when a robot is precise but not accurate. The same lesson applies to college data.
Summary
This article explains the difference between precision and accuracy in university statistics and why that difference matters when you evaluate colleges. It shows how repeatable, neat numbers—like graduation rates or job placement percentages—can be precise yet misleading if the underlying sample or definitions exclude large groups of students. Using concrete examples (Trinity Washington University, University of Mary Washington, University of Houston Downtown, and Cal State East Bay), the piece walks through common traps such as self‑selection, attrition bias, and aggregation fallacies. You will learn a practical mental model (the dartboard analogy), the Value Reinforcement System (VRS) checks to validate claims, and specific questions to ask admissions or researchers. After reading, you’ll be able to spot when a headline statistic applies to you, how to probe the data’s source and sample, and how to avoid decisions based on precise but inaccurate numbers.